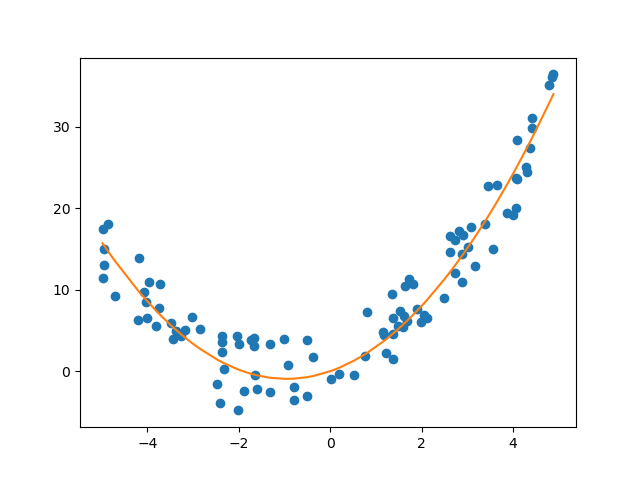
下面我们使用最小二乘拟合的方法去拟合一系列的数据点,该操作常用于在一组数据点中窥见变化趋势。
构造数据集
我们先在 $[-5, 5]$ 范围内容对函数 $y = x^2 + 2x$ 进行均匀随机采样,获得100个数据点:
import matplotlib.pyplot as plt
import numpy as np

x = 5 * (2 * np.random.random((100,)) - 1)
print(x.max(), x.min())

x = np.sort(x)
y = x**2 + 2 * x
x为该组数据点的横座标值,y为对应的纵座标值。
我们给该组数据添加一点随机扰动,让它至少不完全落在函数 $y = x^2 + 2x$ 上:
y += 5 * (2 * np.random.random(y.shape) - 1)
可以使用matplotlib可视化一下:
plt.plot(x, y)
plt.show()
至此,我们得到了一系列数据点。当然,如果手头正好有适合的数据也可以考虑用它来替代刚刚生成的数据点。
拟合多项式
现在我们构造数据集,然后用将这些点拟合成一个二次多项式: $y = ax^2 + bx$,我们需要求解系数a与b的值。
$$ \begin{align} y = ax^2 + bx \tag 1 \\ 式(1)的矩阵形式 \Rightarrow y = \begin{bmatrix} x&x^2 \end{bmatrix} \begin{bmatrix} b \\ a \end{bmatrix} \tag 2 \\ 令A = \begin{bmatrix} x&x^2 \end{bmatrix} , \hat{c} = \begin{bmatrix} b \\ a \end{bmatrix} \Rightarrow y = A\hat{c} \tag 3 \end{align} $$
首先我们构造由$x^2$与$x$组成的矩阵$A$:
A = np.concatenate([x, x**2]).reshape(2, -1).T
矩阵$A$的第0列为$x$,第1列为$x^2$。
我们使用公式 $(A^TA)^{-1}A^Ty = \hat{c}$ 求解系数 $\hat{c} = \begin{vmatrix} b \\ a \end{vmatrix}$:
b, a = np.linalg.inv(A.T @ A) @ A.T @ y
print(a, b)
Note: 此处的$(A^TA)^{-1}$指的是求$A^TA$的逆矩阵,可用numpy的linalg.inv函数计算;另外由于使用的是numpy数组对象所以需要使用运算符@执行矩阵乘法。
现在我们可以使用系数a与b重新生成对应的纵座标_y,并进行可视化:
_y = a * x**2 + b * x
plt.plot(x, y, 'o', x, _y, '-')
plt.show()
